
Interactive line charts
Visualize dense series with zoom, pan, cursors, and legends — data stays in typed arrays.
Rekhly JS is built for streaming, scientific, industrial, and financial web apps. WebGL first, Canvas fallback, one public API.
Visualize dense series with zoom, pan, cursors, and legends — data stays in typed arrays.
Ingest with Float32 / Float64 buffers. Partial updates instead of re-uploading entire series.
Stack synchronized views for medical, industrial, and spectrum-style dashboards.
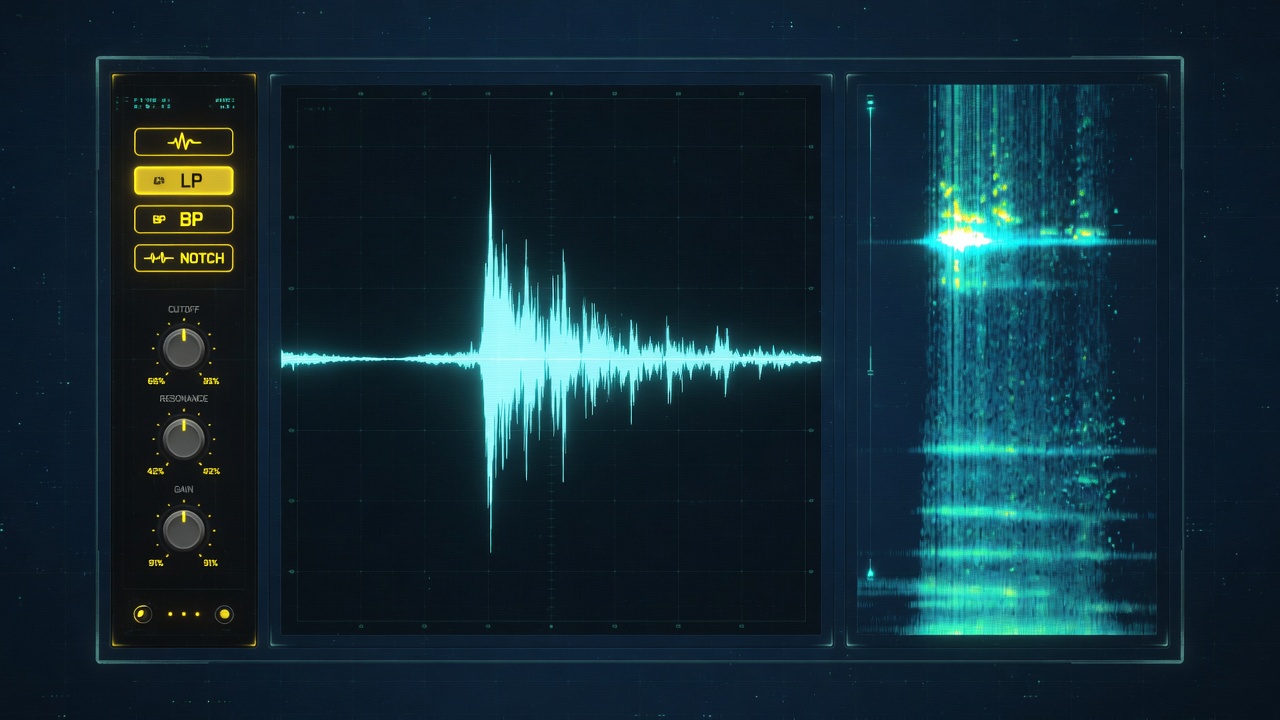
Every example is a real chart on the Rekhly engine. Open the gallery, the playground, or the light-weight and extreme dashboards.
Use the HUD and published benchmarks. We do not invent FPS or point-count claims.
XY, heatmaps, polar, parts (pie, gauge, funnel), 3D, maps, and finance.
rekhly.chartXY({ container }).addLineSeries().setData({ x, y })
Official hosts that keep high-frequency data out of React state.
Ring buffers, coalesced ingest, WebSocket-friendly binary frames.
Dark, light, midnight, ocean, and custom tokens via createTheme.
| License type | Evaluation | Application | Enterprise |
|---|---|---|---|
| Use in web apps | ✓ | ✓ | ✓ |
| 2D + 3D charts | ✓ | ✓ | ✓ |
| Commercial distribution | — | ✓ | ✓ |
| Technical support | Community | Standard | Priority |
| Price | Free trial | Get a quote | Talk to us |
The TypeScript entry to the Rekhly visualization engine for browsers and webviews.
No. Rekhly is an independent renderer stack. Charts never call WebGL except inside @rekhly/renderer-* packages.
Yes. @rekhly/react hosts the engine and keeps streaming data in typed arrays.
Yes — see Rekhly Trader for candles, overlays, and volume.
Got any questions? I'm happy to help with products, licensing, and examples.