
★★★★★
We put Rekhly into our acquisition product for high-end time series and X-Y charts. The component is stable enough to leave running on long sessions.
Engineering lead · Test instrumentation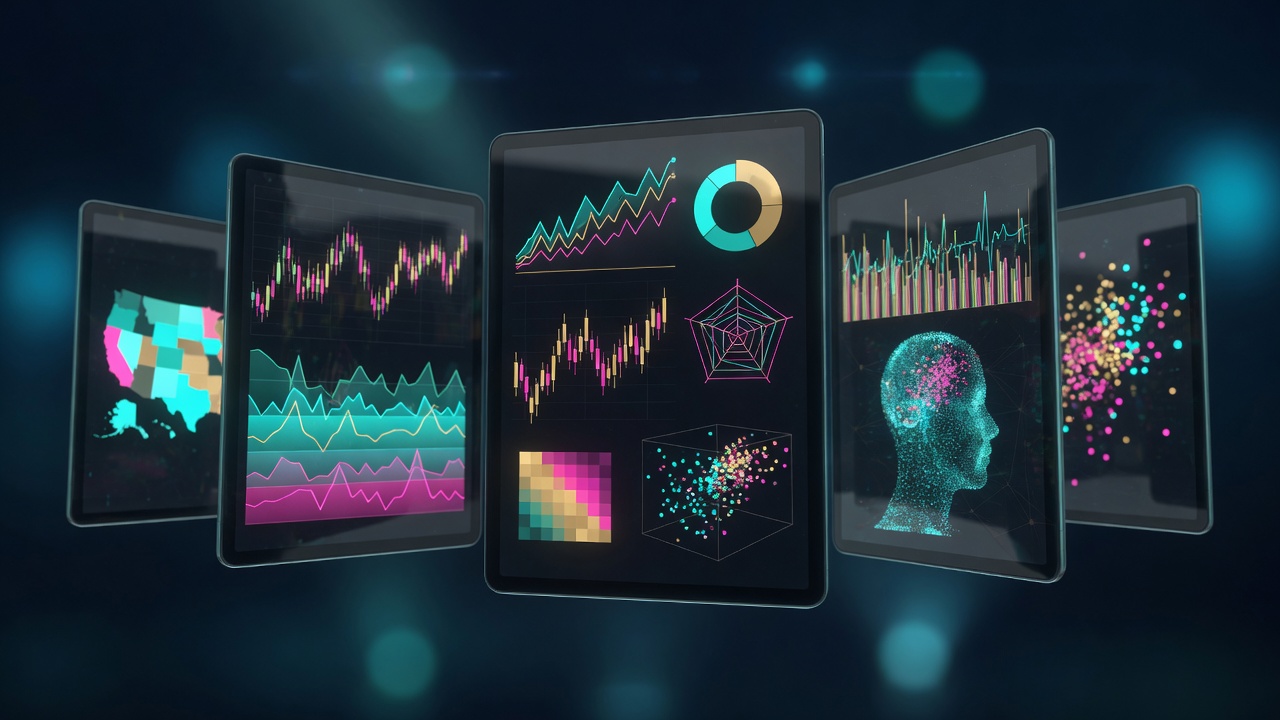
Rekhly handles the demanding visualization work: live streams, million-point typed-array datasets, and dashboards that stay interactive under load.
One renderer stack powers every chart — WebGL by default, an automatic Canvas fallback, and a WebGPU path waiting behind the milestone gate.
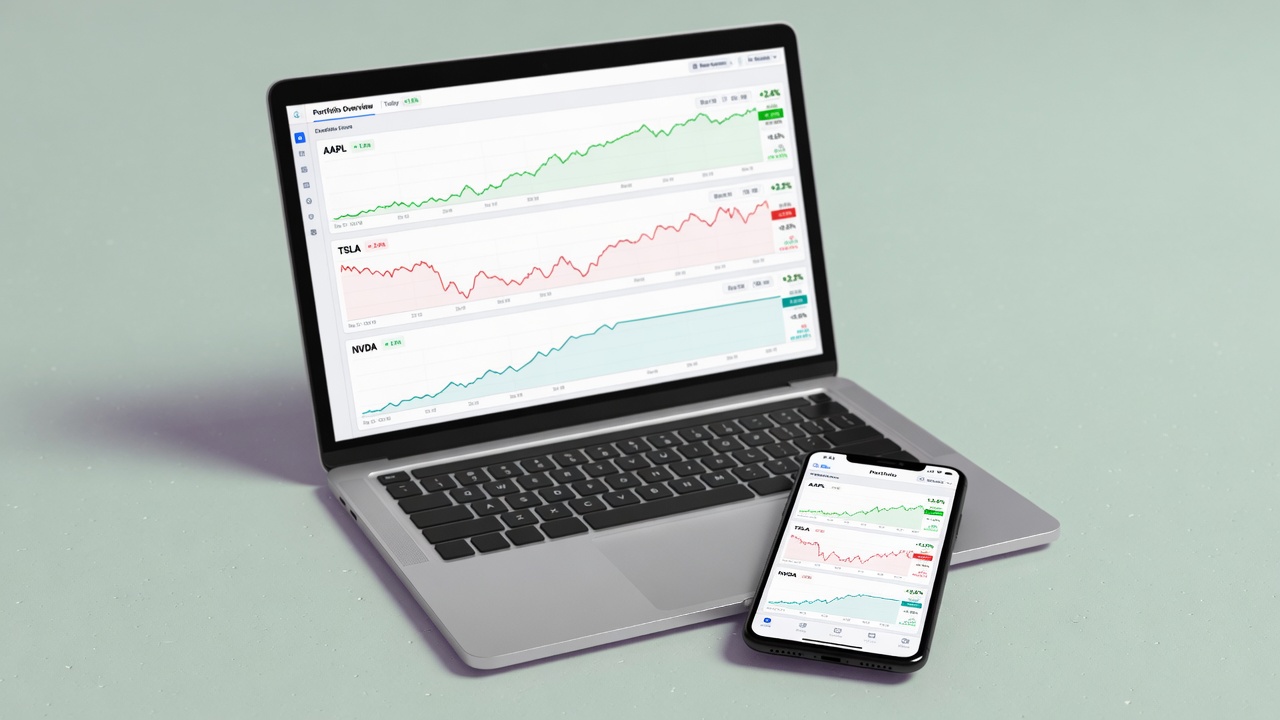
Drop Rekhly charts and dashboards into web, mobile, desktop, server, IoT, and intranet apps without swapping renderers between platforms.
Start faster with official templates for TypeScript, React, Next.js, and Python.
Get started →Drop Rekhly chart components into a standalone dashboard or wire them straight into an existing app — the API doesn't change either way.
Retheme, recolor, and reconfigure entirely through the public chart API — no forking the renderer to get the look you want.
Browse the gallery →Rekhly JS uses WebGL as the primary path and Canvas as a reduced-capability fallback. A WebGPU renderer exists in the stack and stays gated until that milestone is marked ready.
The engine offloads drawing to the GPU whenever the host supports it. Series data stays in typed arrays — it is not copied into React state or one JavaScript object per point.
We put Rekhly into our acquisition product for high-end time series and X-Y charts. The component is stable enough to leave running on long sessions.
Engineering lead · Test instrumentationWe needed something fast, versatile, and easy to theme for calibration and pattern preview. Rekhly replaced a pile of ad-hoc canvas code.
Software engineer · OpticsMultiple real-time series stay interactive. Integration in a TypeScript app was straightforward and the renderer fallback behaved.
Application developer · Industrial UIA power-tools manufacturer streams motor logs into a live Rekhly dashboard for field diagnostics.
Continue reading →A multi-asset desk replaced brittle SVG charts with Rekhly Trader candles, depth, and overlays.
Continue reading →An operations center visualizes satellite and ground-station telemetry with streaming XY and 3D views.
Continue reading →Got any questions? I'm happy to help with products, licensing, and examples.